ORHT / LTB · 1998–2025

27 years of tribunal activity, made explorable

Institutions change, sometimes in ways that are difficult to see from year to year. Looking back at what the Landlord and Tenant Board has said about itself, what it measured over the years and how its operations have evolved helps us understand where it has been, where it may be heading and gives us a basis for asking whether that is where we want it to go.

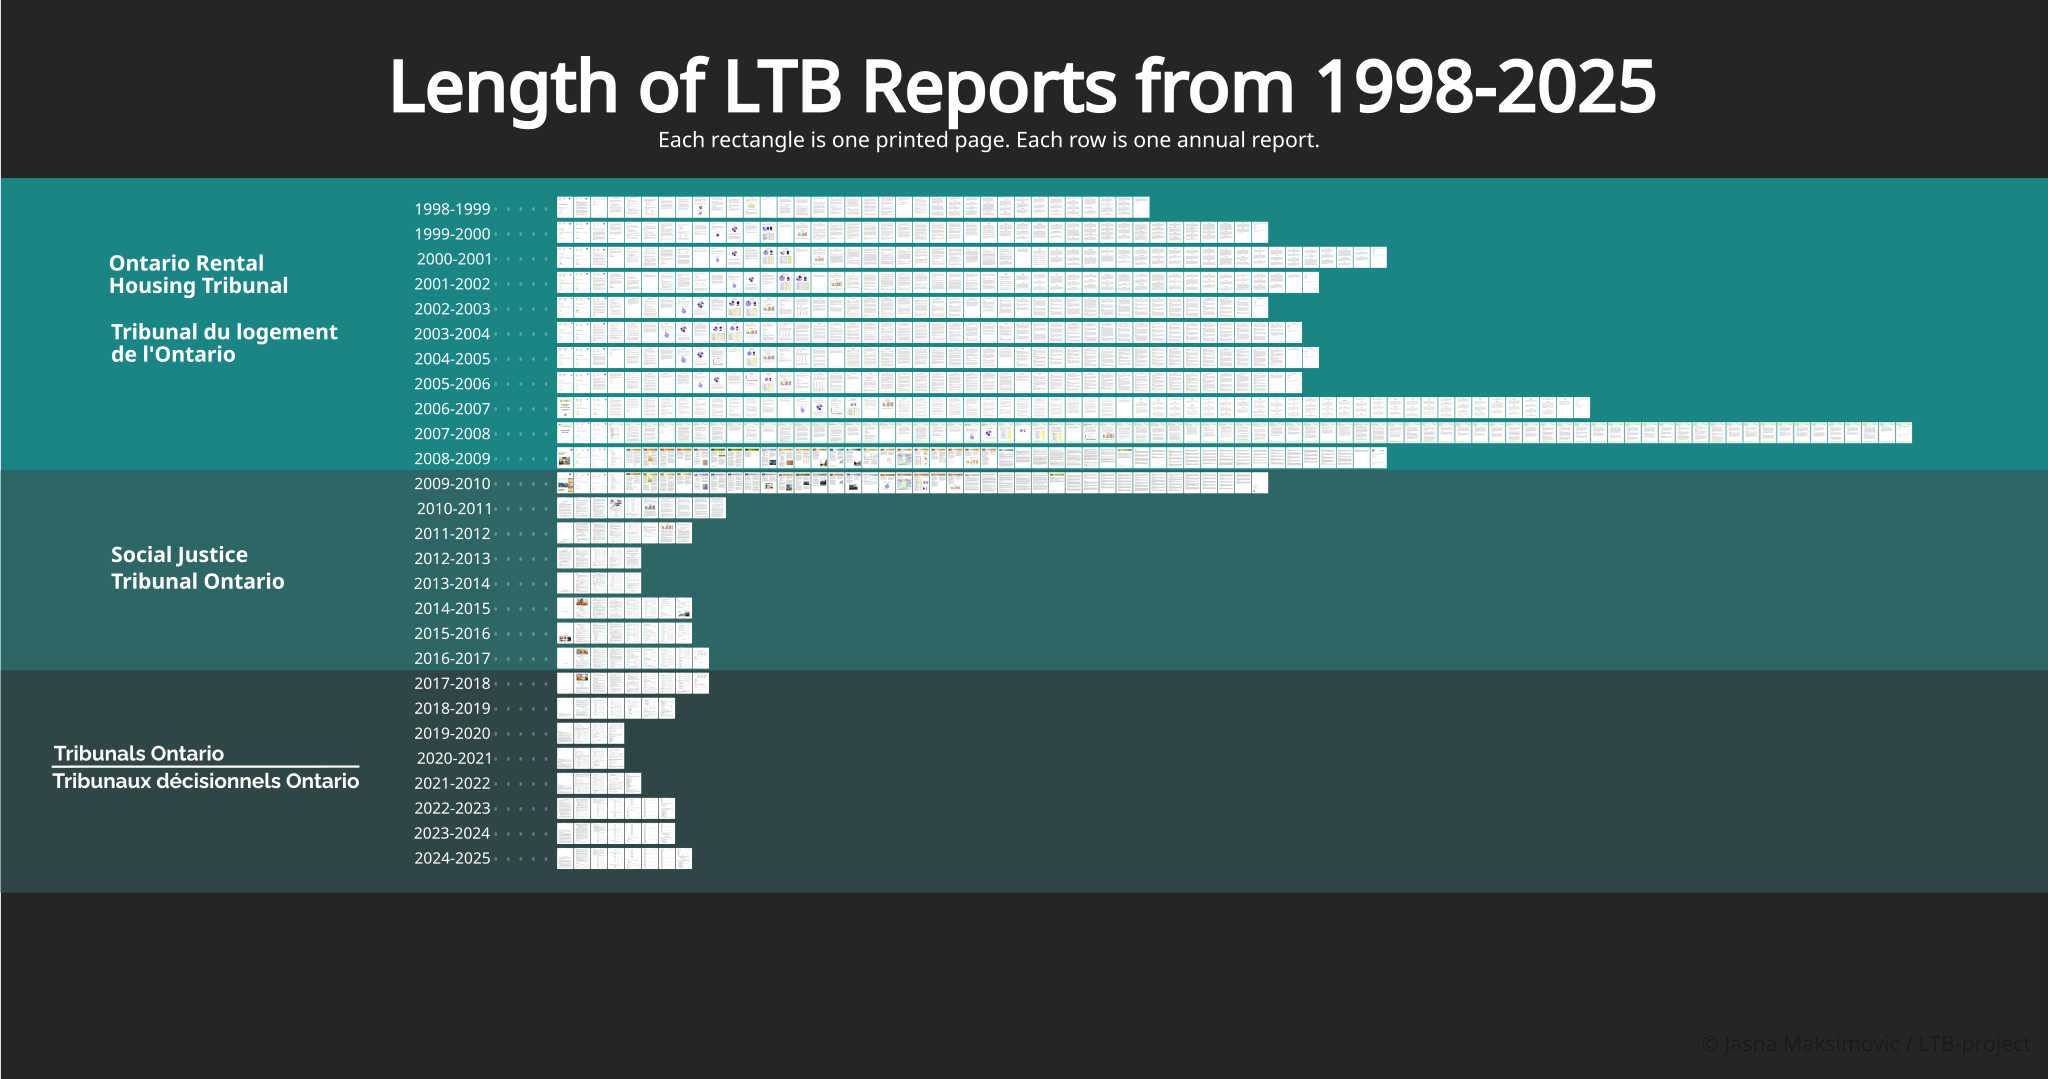
Annual report pages arranged in rows from 1998–99 through 2024–25, showing changes in report length and institutional reporting eras. Ontario Rental Housing Tribunal era 1998-2008, Social Justice Tribunal Ontario era 2009-2016, Tribunals Ontario era 2017 to present. Report lengths (in pages): 1998-99 35, 1999-2000 42, 2000-01 49, 2001-02 45, 2002-03 42, 2003-04 44, 2004-05 45, 2005-06 44, 2006-07 61, 2007-08 80, 2008-09 49, 2009-10 42, 2010-11 10, 2011-12 8, 2012-13 5, 2013-14 5, 2014-15 8, 2015-16 8, 2016-17 9, 2017-18 9, 2018-19 7, 2019-20 4, 2020-21 4, 2021-22 5, 2022-23 7, 2023-24 7, 2024-25 8
The annual-report corpus as an object. Right click to enlarge.
Later implementation will allow users to click on a report filmstrip and see it in full.
To view reports immediately, please visit the GitHub repo.

01 / Applications received

Applications received over time

The long view makes the scale and persistence of the pattern visible. Landlord-filed applications remain the dominant stream as the tribunal’s total workload rises and falls; tenant-filed applications remain much smaller. More research is needed to investigate the reasons behind this.

02 / Application volume

How much volume is eviction-related?

This chart adds L1, L2 and L4 applications and compares that sum with all applications received. It shows how closely these three eviction-related application types move with the tribunal’s overall workload.

Derived comparison

L1 + L2 + L4 applications and all applications received

1999 to 2025

Loading chart…

Derived by summing reported L1, L2 and L4 case counts for each reporting year. The grouping is a project definition, not an official LTB category.

Inspect the data and calculation
Report yearL1L2L4L1 + L2 + L4All applicationsShare of total

Source: eviction_related_l1_l2_l4.csv, calculated from reported case counts in app_type_metrics.csv and annual totals in operational_metrics.csv.

03 / Institutional visibility

What the LTB makes visible though public reports changes over time

Measures are introduced, revised, grouped differently, left out of reports or replaced. A disappearance from annual reporting is evidence of change in public visibility only.

PerformanceThresholds and groupings change

Business-day standards later give way to calendar-day KPIs and a case-lifecycle measure.

MediationDenominators and detail change

The activity remains visible while long-run outcomes become harder to compare consistently.

Service & accessDifferent dimensions appear

Physical locations, filing channels, hearing modes, language and accommodation appear with different levels of detail.

Read more